This is a guide for downstream users unfamiliar with the intricacies of structural biology data to help them to pick the best possible model for their calculations.
Choosing Between Multiple Structures: Overall quality indicators
You may have a number of experimental protein structures to choose from, but which one should you choose? As a good starting metric, a higher resolution (lower number) will likely have yielded a more accurate model as more experimental information was available compared to a lower resolution structure. Typically, at 1.2 Å, you should clearly see the backbone and sidechains, at 2.5 Å you’ll get protein backbone and many of the side chains will be clear if a little undefined, at 3.5 Å you’re down to back bone and only bulky residues being clear, and at 5.0 Å or lower the backbone will be mostly clear and most side chains will not be clear. Overall, the resolution you require will depend on your goals, structure-based drug design for example will likely require well-resolved side chains to provide meaningful insights, but dynamic studies on whole domains can work with much lower resolutions.
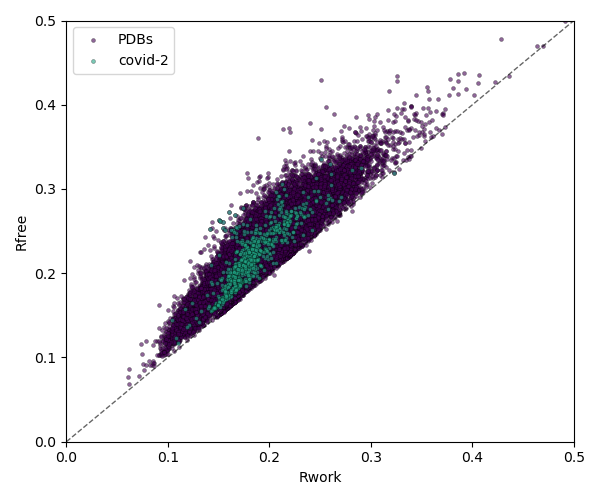
Beyond resolution, there are a number of other metrics to pay attention to when selecting your structural model. One of the most prominent are crystallographic R-values (Rwork and Rfree), which suggest how well the model fits to the measured data. These two values should be as low as possible, but R values vary based on resolution, software, and data pathologies such as twinning. The gap between the Rwork and Rfree also shouldn’t be too large, as a large gap suggests over refinement of the structure.
Finally, the PDB offers a number of validation metrics, which we also calculate for structures in our data base, such as the clash score, Ramachandran outliers (a judge of secondary structure backbone angles), side chain outliers (unfavourable rotamer conformations), and Real Space R-value (RSR) Z outliers (quality of fit between the model and the data in real space). These are displayed on a slider with ideal values relative to other deposited structures of equivalent resolution.
A list of quality indicators can be found here.
Once you have selected a model, we recommend you check our repository for models that have been reprocessed manually, or at least been through our automatic evaluation pipeline.

Checking an individual structure
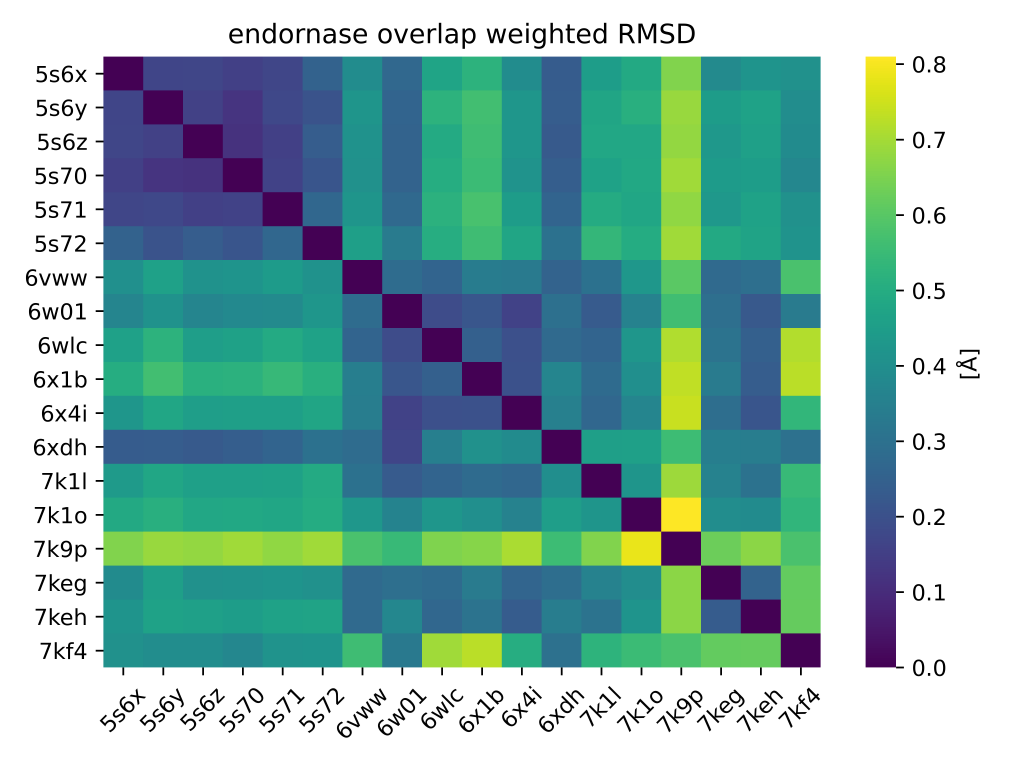
Once you have decided on a model, or if you are unfortunate enough to have just the one structure available, there are still some things you should check: First, your model may not be complete. Only a part of the structure may have been used as sample – for example, transmembrane domains may have been deleted in the genetic construct used to produce the protein. In our data base, we offer sequence alignments as well as model similarity analysis for all of the SARS-CoV and SARS-CoV-2 proteins for all PDB entries relating to that structure, making it easier for you to pick the right structure.
Disordered loops that can’t be seen in the electron density are also routinely not modelled; individual atoms can also be deleted if there’s no experimental evidence in the maps for their location. In addition to missing side chain atoms, atoms that appear in a model viewer can, in reality, have had set their occupancy to 0 for the same reason. Simply looking at the residue in a model viewer such as Pymol can be misleading as it’s not obvious that the positions and conformations these atoms adopt are not derived from the experimental data. The same can be said for atoms with very high B-factors relative to other surrounding atoms.

Building the Biological Assembly
Another consideration is that if your protein of interest is a dimer, trimer, tetramer, etc the whole structure might not necessarily be present upon opening a pdb file. The PDB file provides just enough information to define the unique part of the crystal, so if the second molecule of, say, a dimer is related by the symmetry of the crystal it will need to be generated to get the “biological assembly”. You can do this in PyMol by generating symmetry mates and then saving the molecules you want to a single file. If you’re really unlucky the protein might not have crystallised in a way that the biological assembly can be formed because of crystal packing. If that’s the case, you’ll have to go searching for a different crystal form (look for different space groups and unit cell sizes).
Readme.md in the data base
In order to make it easier for you to choose which structure to use, we have compiled information about each structure in readme.md files which you can find in the base folder of each PDB entry in our data base. They contain a short description which describes this structure and why it has been solved, along with a picture and several quality indicators. However, if you are still unsure, feel free to drop us an email!
